
Announcements
Editor’s choice
Announcements
Any efforts to understand or address agricultural production need to start with fundamental questions: Which crops are being planted every year? Where exactly are they being planted? How much is produced? And how much land is being used to produce it?
The Global Subnational Agricultural Production (GSAP) database aims to gather the answers to these questions, and to make them available to policymakers and decisionmakers working to improve food security at all levels.
Databases that provide the global view of agricultural production at smaller scales have come up short, despite widespread recognition of such information’s importance. Not having this type of information available results in the reliance on outdated, costly or inaccurate modelling efforts, which leads to poor understanding of current agricultural production at a global scale and hampers efforts to improve food security worldwide.
While most countries collect reliable local data on their agriculture sectors and publish them through their national statistical offices, this information has yet to be tapped into for a global outlook.
Agricultural production is changing in the face of increasing demographic pressures, pervasive effects of climate change, growing water and fertilizer scarcity, soil erosion, and geopolitical tensions leading to increased risks for food-importing countries. A global view of smaller scales of agricultural production will allow policymakers and other decision-makers to respond to these challenges empowered with spatially explicit, accurate and up-to-date information on food systems.
The GSAP dataset is the first standardized global subnational agricultural production database that covers key global crops and is both updated (2010–21) and comprehensive in global country coverage. We collect past and current data from national agricultural censuses and surveys, at the highest resolution available (districts, provinces, regions), for the world’s 50 most relevant crops. These include the world’s main grains, such as wheat, maize, rice and soybean, as well as crops important for local economies or food security such as cassava, yams, coffee and cocoa.
The finer scale of GSAP data versus national crop production data and models allows for a better integration with Earth-observation and socio-economic data. This should lead to more accurate analyses of drivers and risks of crop production and associated socioeconomic impacts, such as financial and humanitarian risks.
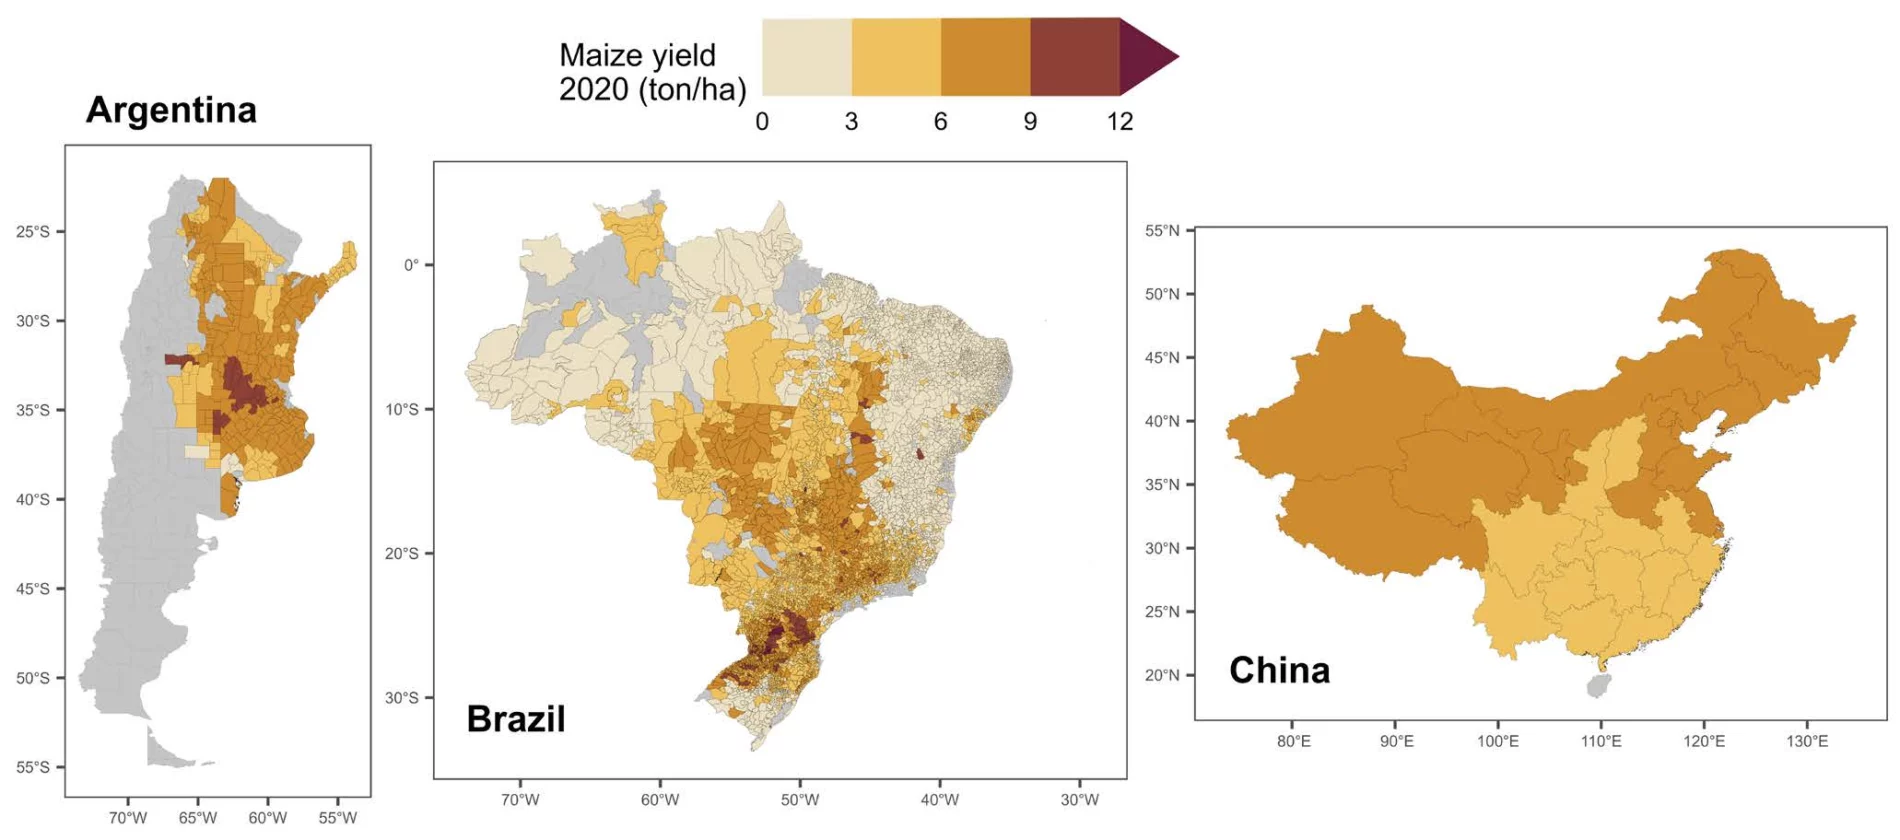
Figure 1. Example of subnational yield data. Maize yields in Argentina, Brazil and China at a subnational scale, in 2020. Along with the US, these are the world's main producers of maize.
Source: author’s own
Without this global view of smaller scales of agricultural production, we face an information gap that leads to uncertainty in the prioritization of investments in agricultural research and development, forecasts of local food production and associated variability caused by changes in climate and productive conditions, and future regional geopolitical and humanitarian scenarios. Moreover, this critical information gap hampers efforts to achieve the Sustainable Development Goals (SDGs) 1 and 2.
Currently, the main source of information for global agricultural production data is FAOSTAT, which provides agricultural data at a national resolution. The available global crop maps that are widely used across different communities are either outdated (Monfreda et al., 2008) or based on estimated crop presence using suitability models (e.g. MapsPAM, GAEZ). Current attempts to bypass the basic need for subnational agricultural data are costly and yield large uncertainty.
Having this information would increase the accuracy of analyses of agricultural production and global yield gaps. It would also boost the work of researchers, practitioners and policymakers in fields as diverse as rural development, food security, climate change, land use, development finance and supply chain sustainability.
The approach used by the GSAP team can be summarized as follows:
The first phase of GSAP demonstrated the viability of obtaining the necessary data, as well as the efficacy of the method developed by the GSAP team. Our team found that subnational agricultural information is widely available from the same national entities that annually report to FAO, and we confirmed that the information we collected is consistent with the figures reported by FAO.
185 countries
Containing upwards of 30 000 subnational jurisdictions
Around 15 000 subnational jurisdictions
These mapped jurisdictions produce:
Figure 2. Example of subnational production data. Cassava production in Thailand and the Democratic Republic of Congo at a subnational scale, in 2019. Along with Nigeria and Brazil, these are the world's main producers of cassava.
Source: Author’s own
While the first phase showed viability of the GSAP project, we need to expand on this success to make the best use of the available data. The potential path to achieve that would include:
GSAP data have the potential to improve the accuracy, relevance and applicability of several avenues of investigation. Some of the sectors and research fields that are set to benefit most include:
This project is ongoing, supported with funding from the SEI Seed & Innovation Fund.
Press release / A new journal article in Frontiers in Animal Science urges a holistic approach to animal agriculture balancing needs of humans, animals and environment.
Journal article / The authors examine seven common strategies for feeding everyone with a smaller carbon footprint and analyse each for their consequences and benefits.
Past event / Sarah Laptain hosts four early career researchers delving into the themes of food security, climate change, and infant nutrition in this informal event.
Design and development by Soapbox.